What is Spark Profiler?
Spark Profiler is one of the administrator tools already bundled into Paper.
The function of spark is to make detecting the source of lag on a server easier.
It's generally used to detect lag spikes or consistent lag
Note: This page may not be very beginner-friendly. The author tries to explain in detail as simply as possible, but it can't be made too simple.
Lag Spike
A Lag Spike is lag that happens for a number of seconds, but is quite severe.
Case example: A server running at 20 TPS below 50 MSPT, suddenly experiences an MSPT spike up to 800 and TPS drops to 1.2, but this spike only lasts for 2 seconds. However this happens quite often in close succession, like "it feels like it lags really badly every few minutes."
The way to fix it is by running these commands in stages:
/spark tpsThen a display like the following will appear:
[17:26:51 INFO]: [⚡] TPS from last 5s, 10s, 1m, 5m, 15m:
[17:26:51 INFO]: [⚡]  *20.0, *20.0, 1.2, *20.0, *20.0
[17:26:51 INFO]: [⚡]
[17:26:51 INFO]: [⚡] Tick durations (min/med/95%ile/max ms) from last 10s, 1m:
[17:26:51 INFO]: [⚡]  4.2/5.8/7.6/12.5;  4.2/6.8/9.0/800.0
[17:26:51 INFO]: [⚡]
[17:26:51 INFO]: [⚡] CPU usage from last 10s, 1m, 15m:
[17:26:51 INFO]: [⚡]  7%, 8%, 9%  (system)
[17:26:51 INFO]: [⚡]  7%, 8%, 9%  (process)
It can be seen that the TPS from last 1m is at 1.2, while the Tick durations max ms from last 1m is at 800.0.
The other numbers look normal (MSPT 95%ile below 50ms, both last 10s and last 1m).
So it can be certain that a lag spike has occurred in the last minute.
/spark tickmonitorAfter running it, the server will calculate the server's average tick, and will print all ticks that are far above the server's average tick.

Tick#184 lasted 813.78ms.
Tick#318 lasted 337.26ms.
So the lag spike occurs above 300ms up to 800ms.
/spark profiler start --timeout 300 --only-ticks-over 270This will turn on the spark profiler for--timeout 3005 minutes (300 seconds) and will only profile--only-ticks-over 270ticks above 270ms.
Huh, why 270ms and not 800ms?
Ideally, we lower the number being profiled, but not too far, so the lag spike is really detected.
Also because 813ms is above 270ms, then if there are other ticks that take longer than 270ms even up to 10000ms, they will be profiled too.
After 5 minutes, the console or chat will write text that profiling is done, and then the link will appear in chat. Don't worry because only the console and people who have spark permission can read that link chat notification.
- Open the spark profiler result
Open and scroll down. If you're a beginner, you don't need to set anything, just expand the profile tree by clicking the
[>] on Server thread %button.
Keep opening the thread with the highest percentage until the innermost task.
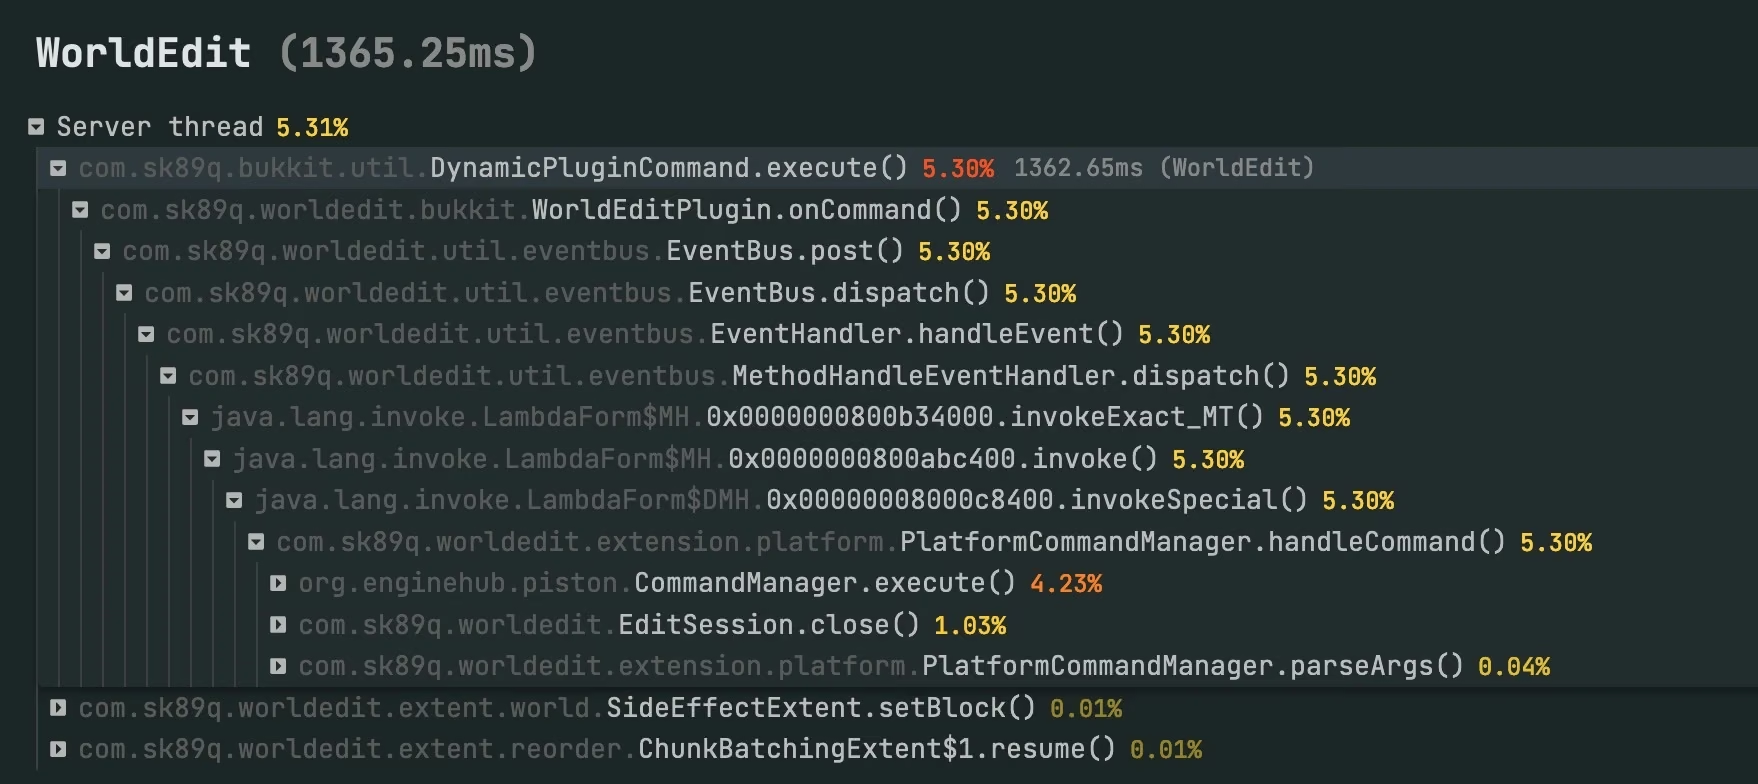
You can see org.enginehub.piston.CommandManager.execute() 4.23% inside com.sk89q.bukkit.util.DynamicPluginCommand.execute() 5.30% 1362.65ms (WorldEdit) followed by com.sk89q.worldedit.bukkit.WorldEditPlugin.onCommand() 5.30%
org.enginehub.piston is a Java Package, CommandManager is a class, and .execute() is a method.
com.sk89q.bukkit.util package, DynamicPluginCommand class, .execute() method, (WorldEdit) is the plugin name.
com.sk89q.worldedit.bukkit package, WorldEditPlugin class, .onCommand() method.
So, there's a WorldEdit command from developer sk89q that executes something and consumes a tick of 1362.65ms, or 5.30% of the total server tick.
- Action
After finding that the cause is a WorldEdit command, one of the steps that can be taken is to restrict access to WorldEdit commands and limit the number of blocks allowed per WorldEdit operation.
The block count or other restrictions can be found in the worldedit config at /home/container/plugins/worldedit/config.yml.
Note: This is only one case example. The causes of lag spikes vary greatly depending on each server's condition.
Constant Lag
Unlike a lag spike, constant lag happens continuously.
Generally, the server CPU isn't strong enough to handle the tasks run by plugins or the Minecraft server itself.
But often this problem is caused by a plugin that indeed has poor optimization of its events, tasks, and looping.
/spark tpsThen a display like the following will appear:
[17:26:51 INFO]: [⚡] TPS from last 5s, 10s, 1m, 5m, 15m:
[17:26:51 INFO]: [⚡]  11.6, 16.7, 13.5, 10.9, 12.1
[17:26:51 INFO]: [⚡]
[17:26:51 INFO]: [⚡] Tick durations (min/med/95%ile/max ms) from last 10s, 1m:
[17:26:51 INFO]: [⚡]  27.1/61.5/74.3/136.8;  39.2/65.8/73.0/101.0
[17:26:51 INFO]: [⚡]
[17:26:51 INFO]: [⚡] CPU usage from last 10s, 1m, 15m:
[17:26:51 INFO]: [⚡]  79%, 87%, 90%  (system)
[17:26:51 INFO]: [⚡]  79%, 87%, 90%  (process)
It can be seen that the CPU Usage from last 1m is 87%, and from last 15m is 90%.
The CPU is working too hard.
It can also be seen that the tick duration 95%ile from last 10s is 74.3 followed by last 1m at 73.0.
This means the average server tick takes 71ms-75ms to process.
The standard is that a server tick takes below 50ms to process.
/spark profiler start --timeout 600 --only-ticks-over 51
This will turn on the spark profiler for --timeout 600 10 minutes (600 seconds) and will only profile --only-ticks-over 51 ticks above 51ms.
Why 51ms and not 73ms? And why not 50ms?
50ms would produce an exact result, so we give an extra buffer of 1 ms.
Just like a lag spike, we lower the number a bit so the sample space becomes larger.
- Open the spark profiler result.
This stage is similar to reading for a lag spike.
Besides percentage, you can also change the thread task tree to Time per Tick by changing Label: Percentage to Label: Time per Tick. This will make it easier for you to imagine how many milliseconds a task takes.
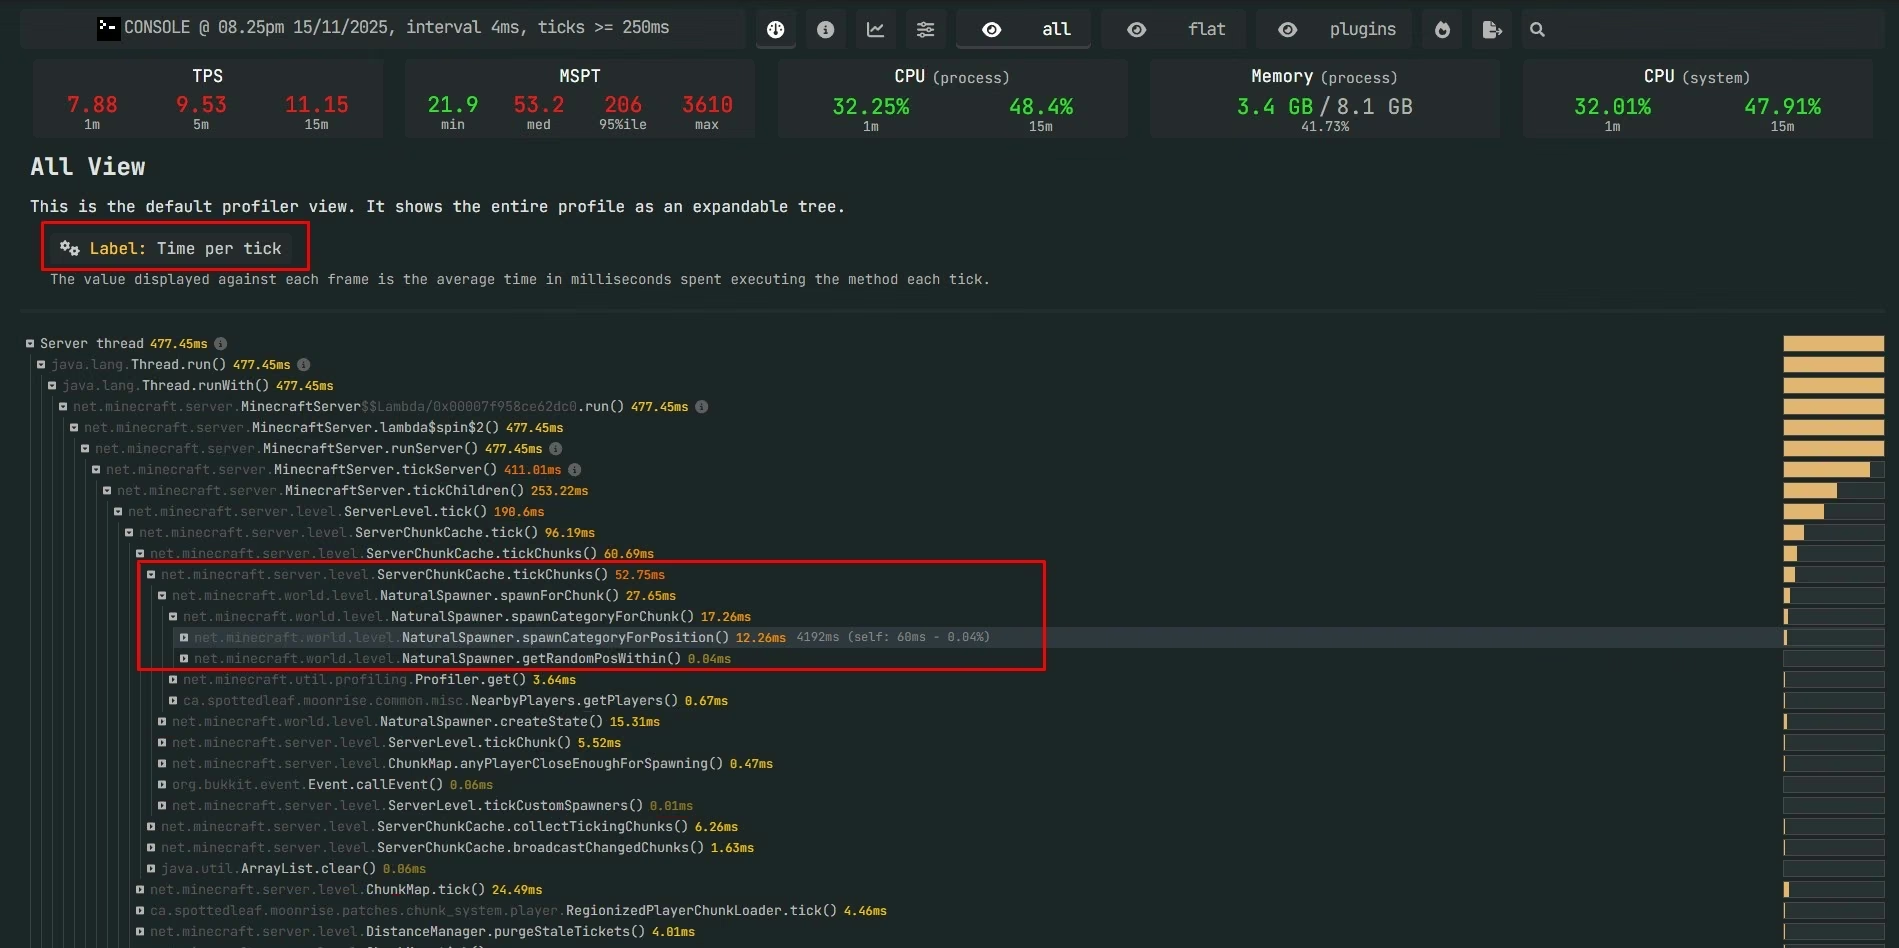
It can be seen that the NaturalSpawner class performs spawnForChunk for 27.65ms, about half of ServerChunkCache.tickChunks.
So the cause is two possibilities:
The first possibility is that the server CPU isn't strong enough to withstand the load of generating fresh chunks, and there might be many players exploring places that have never been explored before.
The second possibility is that the server's simulation distance and/or view distance is too far. This also contributes to the previous possibility, but only in worlds that have never been pregenerated. Because the spawnForChunk task is usually only found to populate newly generated chunks with various mobs like animals or hostiles.
- Action
After knowing the profiling results and mapping out the various possibilities, it's time to take action.
Do chunk pregeneration using the Chunky plugin. It doesn't need to be too big, just enough like a radius of 1000 to 2000 blocks from the center. To calculate the estimated world size, use the World Size Calculator.
Lower simulation-distance= in server.properties to 5. Also lower view-distance= to 8.
More complete: Setelan Ajaib Lancar
Other Information
There are some other things you can take advantage of from the spark profiler.
You can read the graph in the Flame Graph view by clicking the flame button at the top of your spark profiler page.
You can view various graphs at once such as CPU (process), CPU (system) TPS, MSPT, Players, Entities, Tile Entities, Chunks, and see if there's a correlation between one graph and another.
You can view the server configuration settings.
You can view the plugins and datapacks used on the server.
You can view the server implementation and also a brief specification of the server machine.
References:
Lucko. finding the cause of lag spikes.
Last Edited: 13 December 2025.
Author: Jan Wafa Karsiena. License: CC BY-SA 4.0.
