How to Use MTR
MTR on Windows
- Download WinMTR
- Run the application (no installation needed).
- Enter the destination address, for example:
1.1.1.1(Cloudflare DNS)8.8.8.8(Google DNS)- Or the server IP provided by the technician. (example:
103.42.xx.xx)
- Click Start to begin the test.
- Let it run for around 100–200 packets (1-2 minutes) so the results are more accurate.
- Click Stop, then choose Export Text to save the results.
- Send the results to support technicians for analysis.
MTR on Linux
-
Install MTR according to your distro:
- Ubuntu/Debian:
sudo apt install mtr - CentOS/RHEL:
sudo yum install mtr
- Ubuntu/Debian:
-
Run the command with the destination IP, for example:
mtr 1.1.1.1or:
mtr 8.8.8.8(Use the server IP provided by the technician if available) - example:
103.42.xx.xx -
For a non-interactive report (direct results):
mtr -r -c 100 1.1.1.1-r= report mode-c 100= number of packets (for example 100 sends)
-
Copy the MTR results that appear in the terminal, then send them to support technicians.
Example MTR Output
Linux (CLI)
Start: 2025-09-16T21:30:00
HOST: test-pc              Loss%   Snt   Last   Avg  Best  Wrst StDev
  1.|-- 192.168.1.1          0.0%   100    1.2   1.5   1.0   3.5   0.4
  2.|-- 10.10.0.1            0.0%   100    5.3   5.7   5.1   7.0   0.6
  3.|-- 203.0.113.45         2.0%   100   20.1  21.5  19.8  40.0   3.5
  4.|-- 1.1.1.1              0.0%   100   22.0  22.8  21.0  35.2   2.8
Windows
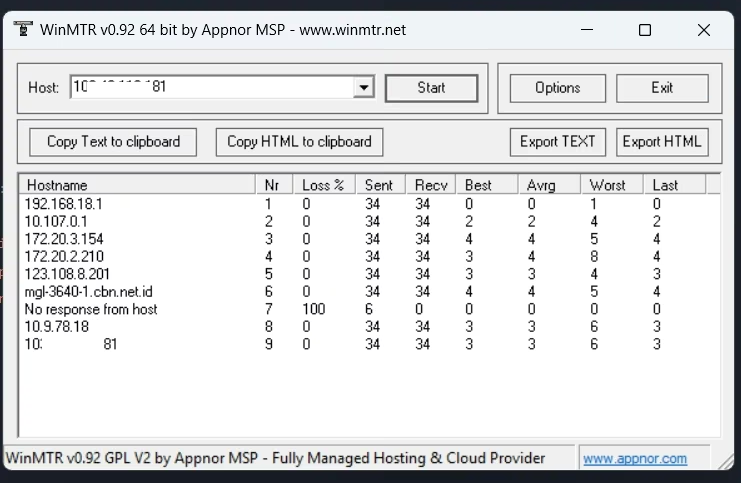
Column Explanations
- Loss% → The percentage of packet loss at that hop.
- Snt → The number of packets sent.
- Last → The last latency (ms).
- Avg → Average latency.
- Best → Lowest latency.
- Wrst → Highest latency.
- StDev → Latency variation/jitter.
Note: If packet loss only appears at an intermediate hop but disappears at the last hop, that's usually normal (a router refusing ICMP for itself). What you need to pay attention to is packet loss at the last hop (the destination).